Problem
The Indian government’s responsibility is to provide public infrastructure that promotes equal access and quality of services. However, there are three major challenges that arise with this goal: governments struggle to tackle large-scale infrastructure changes, budget spending happens haphazardly, and departments have poor planning when applying for government funding grants. This results in a lack of expenditure planning, making it harder for them to effectively manage AWCs, Anganwadis–or preschools, in their region.
Solution
Meraki’s largest initiative is their surveying of preschools in Northern India. They have surveyed around 20,000 preschools on their quality (basic amenities, disability access, quality of teaching) and share this data to policymakers so they can make educated decisions on how to spend money. We would build a dashboard where these policymakers can see the data in digestible ways and hopefully better manage the AWCs they are responsible for.
Design
We approached the problem at hand with a diverse design approach. Since Meraki doesn’t have an established brand, we started by creating rules, in line with their mission in values, to apply to our UI. We then began creating simple and reusable design components from existing UI libraries for consistency during development.
Throughout the design process, we kept in mind the most important aspects of our product: displaying data in an approachable, digestible, and actionable way for our end users. This meant understanding their workflow and existing behavior, with insights into requirements such as web and mobile design parity and OTP login.
Tech Stack
Meraki is built with modern, reliable, and robust technologies to ensure a future-proof system that can work on its own for the foundation and its end users. Care was taken to choose technologies that are familiar to those who will use the web application such as existing Google forms, OTP authentication, and raw data available by export. The web frontend itself is built on top of the “T3 Stack,” an opinionated set of libraries to build web applications with React. A number of other services link this user-facing application with the data Meraki collects.
Features
Authentication and Access Control
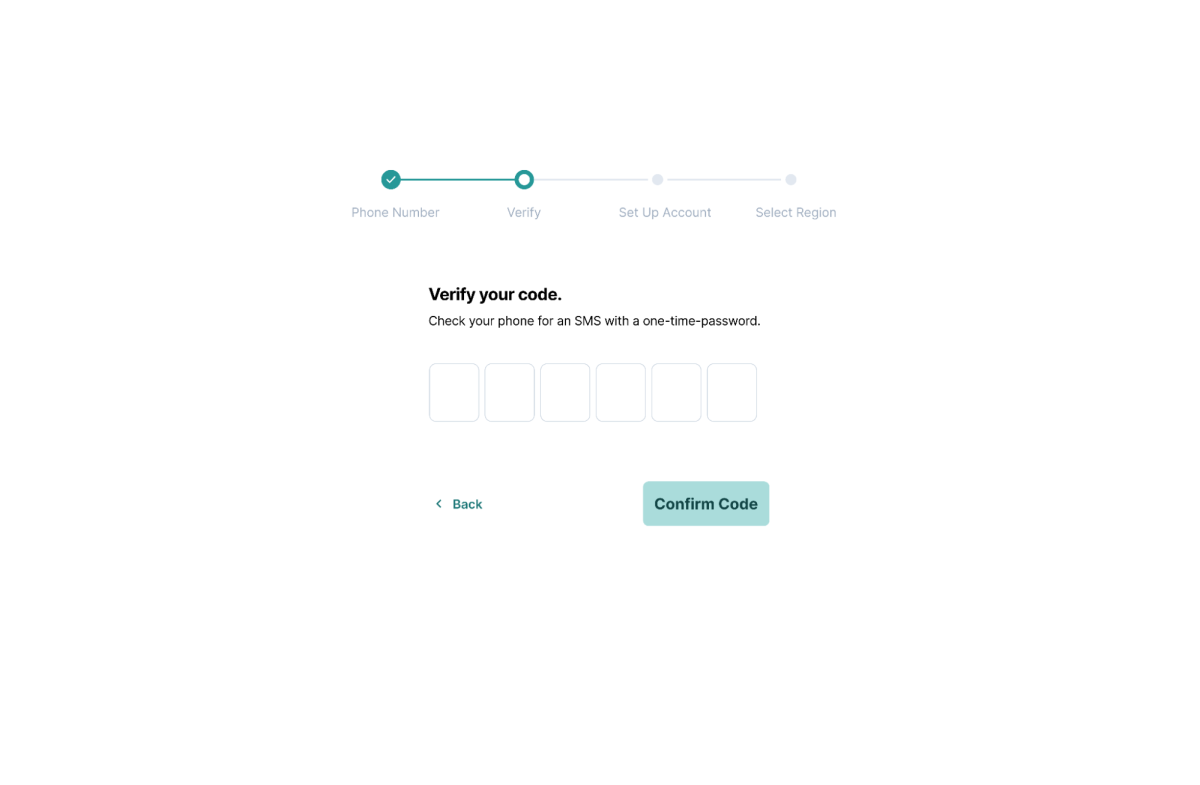
Ensuring secure and personalized access to crucial data lies at the core of our project with Meraki. Our login process begins with users providing their phone number for a one-time password (OTP), along with essential details like name, language preference, and login to a specific region. We opted for OTP authentication, recognizing its familiarity to app users for a smoother experience. Once logged in, users find their view automatically set to the highest level they are authorized to access, aligning with the principle of simplicity and efficiency. We prioritize user privacy by restricting their visibility to only the Anganwadi Centers (AWCs) they are responsible for, preventing data overload and ensuring focused, relevant insights. Additionally, users have the flexibility to select and navigate through various regions such as districts, blocks, and clusters within their jurisdiction, empowering them with comprehensive control over the data relevant to their responsibilities.
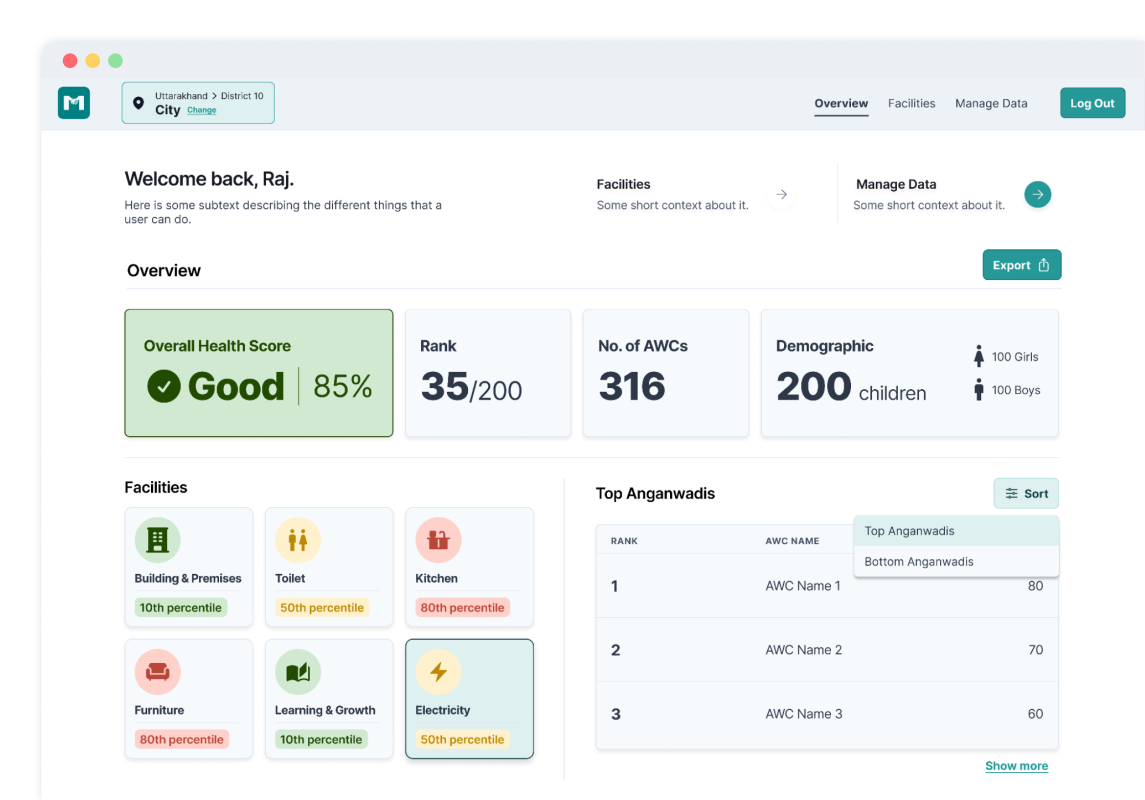
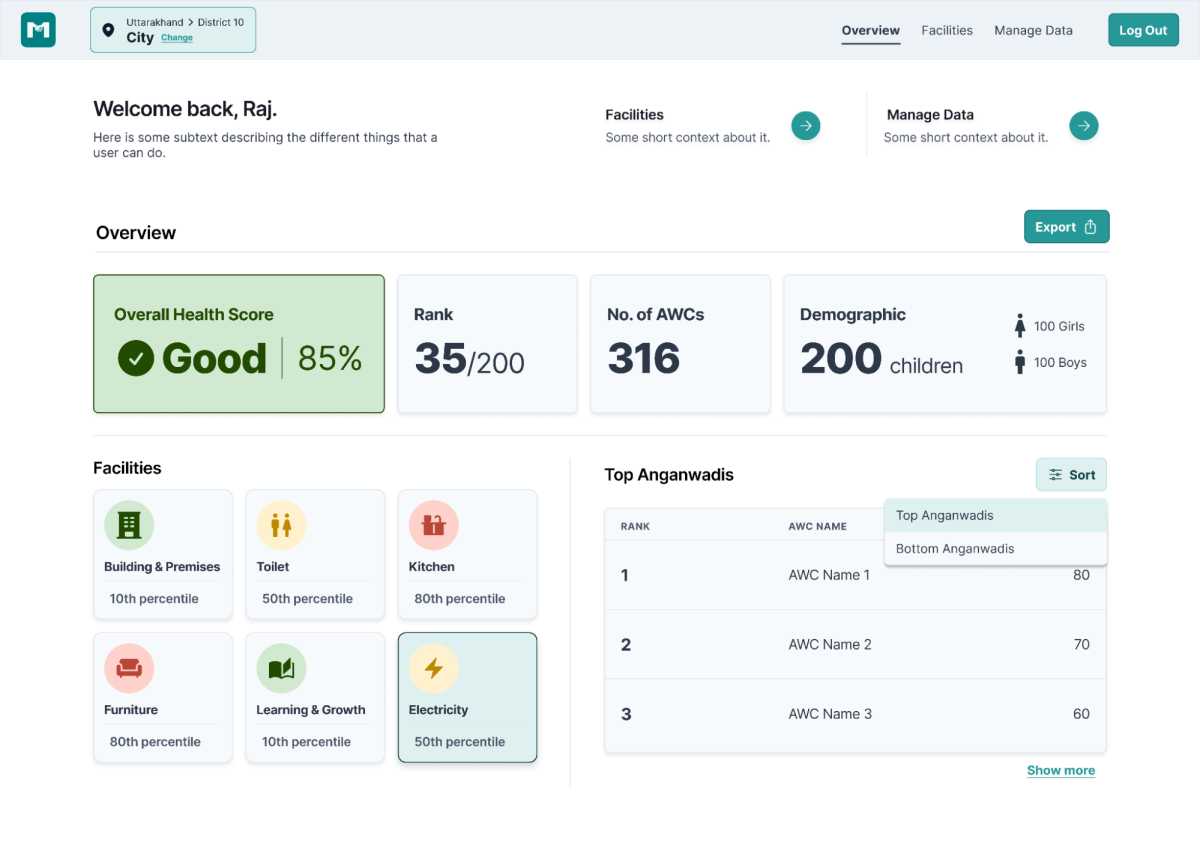
Data Overview
Our innovative data overview feature serves as a powerful tool to facilitate informed decision-making by those responsible for managing AWCs. By presenting high-level data in a summarized and easily digestible format, it empowers policymakers with the insights needed to address challenges in the public infrastructure effectively. The top rankings section highlights the top 5 Districts, Blocks (with district names mentioned), Clusters (with block and district references), and Anganwadis (with cluster, block, and district details). This information is not only insightful in its own right but also expandable to include comprehensive lists for a more in-depth analysis. Additionally, this feature ensures easy access to detailed data analysis, allowing users to drill down and explore specific aspects, contributing to better management of AWCs and ultimately supporting the overarching goal of promoting equal access and quality services in the region.
Data Analysis
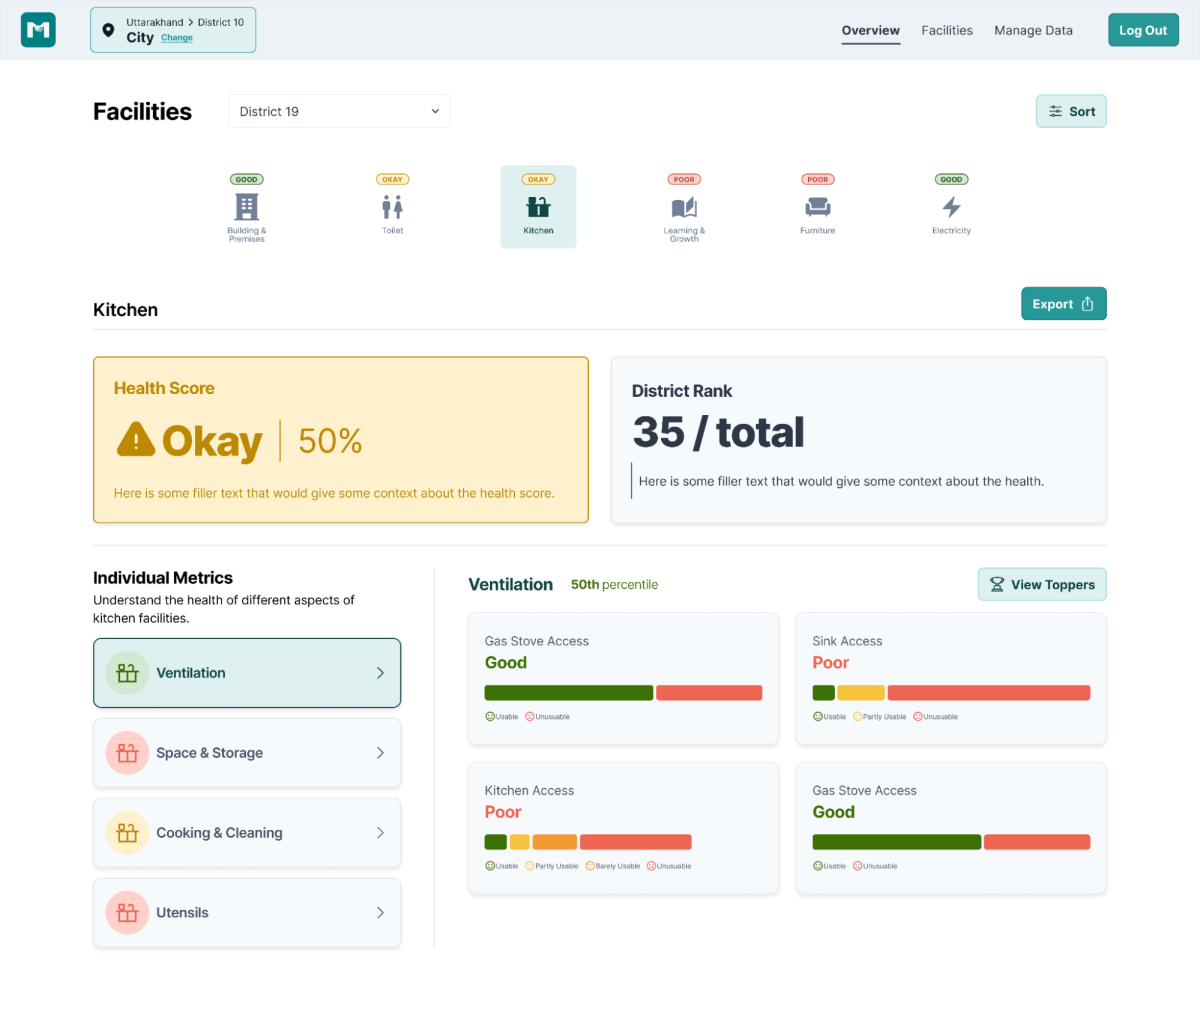
The data analysis dashboard empowers government officials to navigate seamlessly from category to subcategory, gaining insights into the quality of preschools for one or more amenities. For category-level information, officials can view the overall health of AWCs through percentile scores against medians, observe overall ranks, and delve into crucial demographics such as the total number of AWCs and children (boys and girls). The dashboard also highlights the top-performing districts, blocks, clusters, and Anganwadis, providing a comprehensive overview with the option to expand the list for in-depth analysis. Moreover, amenity-level information categorizes amenities as Good, Okay, or Poor based on the mean score of all AWCs for that amenity. Visual representations, such as bars indicating each answer choice, offer a nuanced understanding of responses. To further facilitate data utilization, officials can export relevant information to CSV files with a convenient export button near each subcategory. This feature allows for the flexible selection of specific amenities for download.
Data Management
Another key feature of this dashboard allows users to seamlessly navigate through data for individual AWCs, enabling them to traverse from the first center to the last within a cluster effortlessly. The data is structured thoughtfully, encompassing crucial categories such as general information about each AWC's location, demographics including the number of children, and detailed breakdowns of various subcategories. These subcategories further provide actionable insights through clear indicators like 'Repair required,' 'New required,' 'No Action,' and more. This robust data management system equips policymakers with the necessary tools to make informed decisions.