Problem
The main pain point is that although the Census provides tons of data about response rates, not many conclusions can be drawn from it due to the lack of resources CCL has. They are limited to a small subset of responses (17.5k) out of the 300+ million people living in the United States today. CCL would be able to provide their clients much more reliable response data if they can parse this multitude of data into a readable and understandable display. In addition, even if the data is parsed correctly, there is no easy way for CCL or their clients to compare the data they are getting for each tract. When a census or survey planner is determining which resources to allocate where, they need to be able to have a “summary view” of all of the places they are concerned with.
Solution
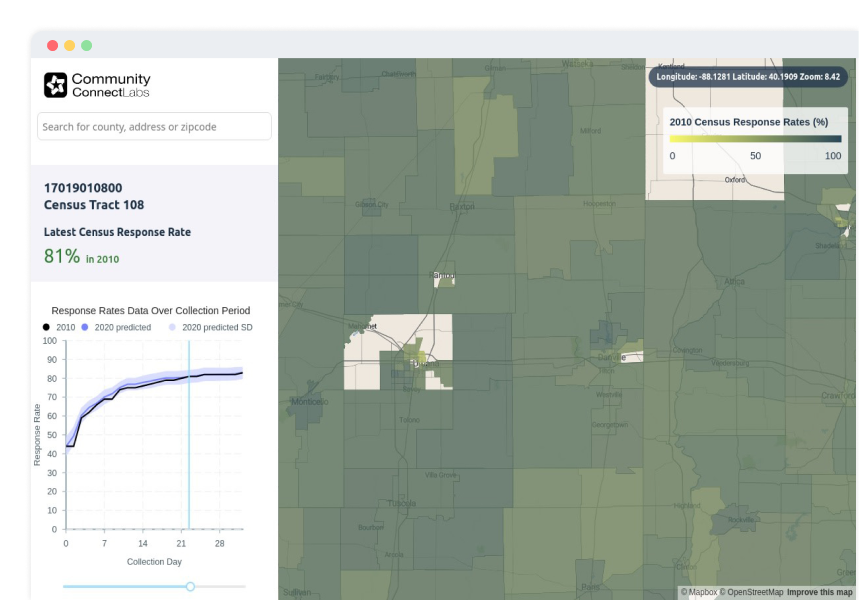
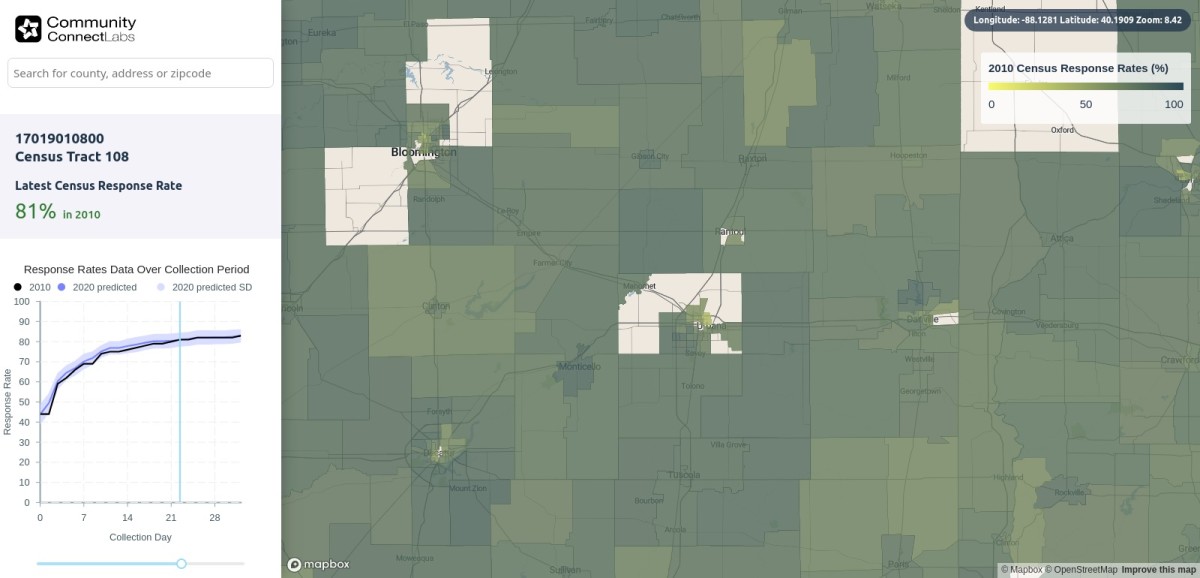
We are creating a publicly available tool with an easily understandable geospatial visualization interface that provides analysis of the large census dataset to increase CCL’s response rate. CCL’s clients should be able to use this tool to make calculated judgments about a tract’s response rate when putting demographics, historical data, and location. They should also be able to make conclusions about a tract’s response rate in the future based on trends in historical data.
Tech Stack
React, Flask, MongoDB, Mapbox
Features
Geospatial Visualization
Both states and census tracts’ overall response rates are displayed on a color scale. On hovering over a tract, the sidebar shows a graph with response rates over the previous collection period.


